With the 2020 Presidential election less than 3 months away, high quality polls are being published in large numbers, giving us a clear understanding of the current state of the race. To help sort through this mass of data, we’ve calculated polling averages in all 50 states, DC, and the nation as a whole. These averages take into account the sample size and type of each poll, and each pollsters’ past performance. In states where few polls are conducted, the data used to generate the polling average is supplemented with the national polling average plus the base partisanship of the state.
| West Virginia | Trump +23.0 |
| Wyoming | Trump +20.5 |
| Nebraska 3rd Congressional District | Trump +19.2 |
| Oklahoma | Trump +17.8 |
| Kentucky | Trump +15.1 |
| North Dakota | Trump +14.7 |
| Alabama | Trump +14.5 |
| Utah | Trump +11.2 |
| Idaho | Trump +11.2 |
| Tennessee | Trump +9.0 |
| Nebraska At Large | Trump +8.2 |
| Indiana | Trump +8.0 |
| Kansas | Trump +8.0 |
| South Dakota | Trump +7.9 |
| Montana | Trump +7.4 |
| Mississippi | Trump +5.7 |
| South Carolina | Trump +5.2 |
| Louisiana | Trump +5.0 |
| Arkansas | Trump +4.5 |
| Nebraska 1st Congressional District | Trump +4.3 |
| Missouri | Trump +3.7 |
| Alaska | Trump +3.0 |
| Texas | Trump +0.5 |
| Iowa | Trump +0.2 |
| Georgia | Trump +0.2 |
| Ohio | Biden +1.2 |
| Maine 2nd Congressional District | Biden +2.5 |
| North Carolina | Biden +2.7 |
| Arizona | Biden +3.9 |
| Nebraska 2nd Congressional District | Biden +5.2 |
| Florida | Biden +5.6 |
| Pennsylvania | Biden +6.6 |
| Wisconsin | Biden +7.3 |
| USA | Biden +7.7 |
| Minnesota | Biden +8.0 |
| Michigan | Biden +8.2 |
| Nevada | Biden +8.3 |
| New Hampshire | Biden +9.7 |
| Virginia | Biden +10.0 |
| Maine At Large | Biden +11.4 |
| Colorado | Biden +12.0 |
| Oregon | Biden +12.3 |
| New Mexico | Biden +12.6 |
| Illinois | Biden +14.5 |
| Delaware | Biden +14.9 |
| Rhode Island | Biden +16.7 |
| New Jersey | Biden +17.6 |
| Connecticut | Biden +18.0 |
| Washington | Biden +20.6 |
| Maryland | Biden +21.7 |
| New York | Biden +22.3 |
| Vermont | Biden +22.9 |
| Maine 1st Congressional District | Biden +23.0 |
| Hawaii | Biden +26.3 |
| Massachusetts | Biden +26.4 |
| California | Biden +27.7 |
| District of Columbia | Biden +51.9 |
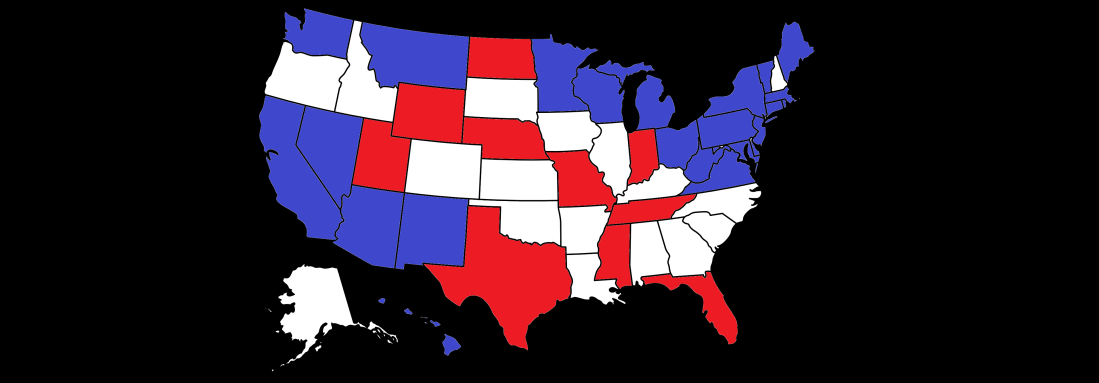
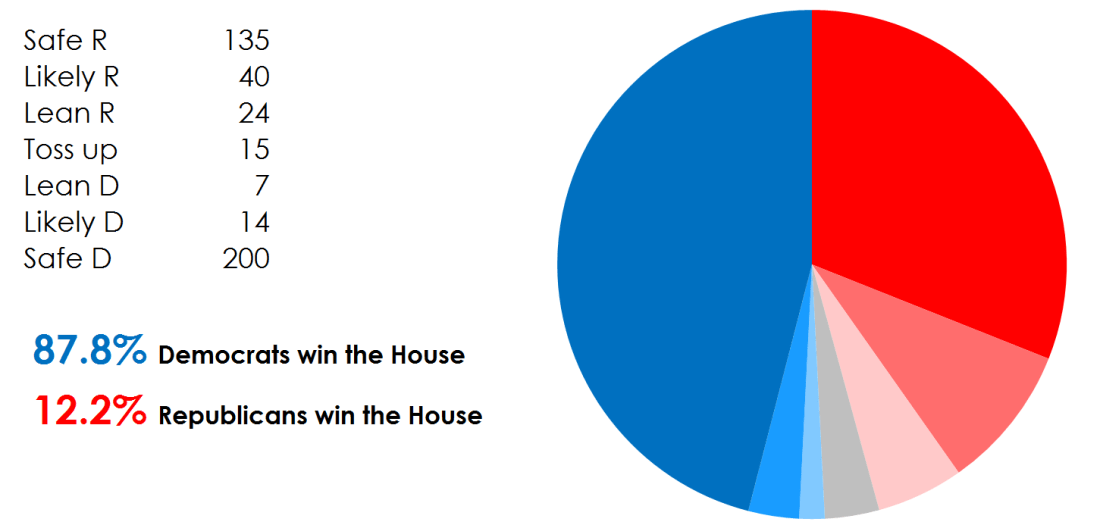
Biden Leads Nationally And In Swing States
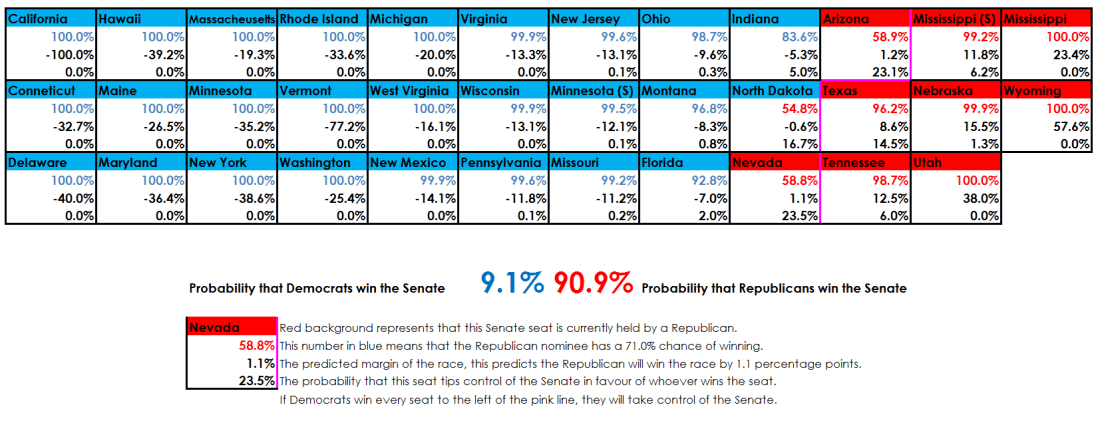
Clearly, these numbers paint a very optimistic picture for Biden, with a 7.7 point national lead. This is a larger lead than Clinton enjoyed at any stage of the 2016 campaign. Additionally, Trump is behind in key swing states, with Biden up 5.6 in Florida, 6.6 in Pennsylvania, 7.3 in Wisconsin, and 8.2 in Michigan. That said it is essential to remember that systematic polling errors do regularly occur. We therefore recommend you expect these averages to be up to 3 points off in either direction. Even with this degree of uncertainty, Biden looks comfortably ahead. His lead only becomes more apparent when the averages are plotted in Electoral College terms as shown in the chart below. Trump is ahead in states worth only about a quarter of the electoral votes, and behind in states worth two thirds, with the remainder being toss-ups.
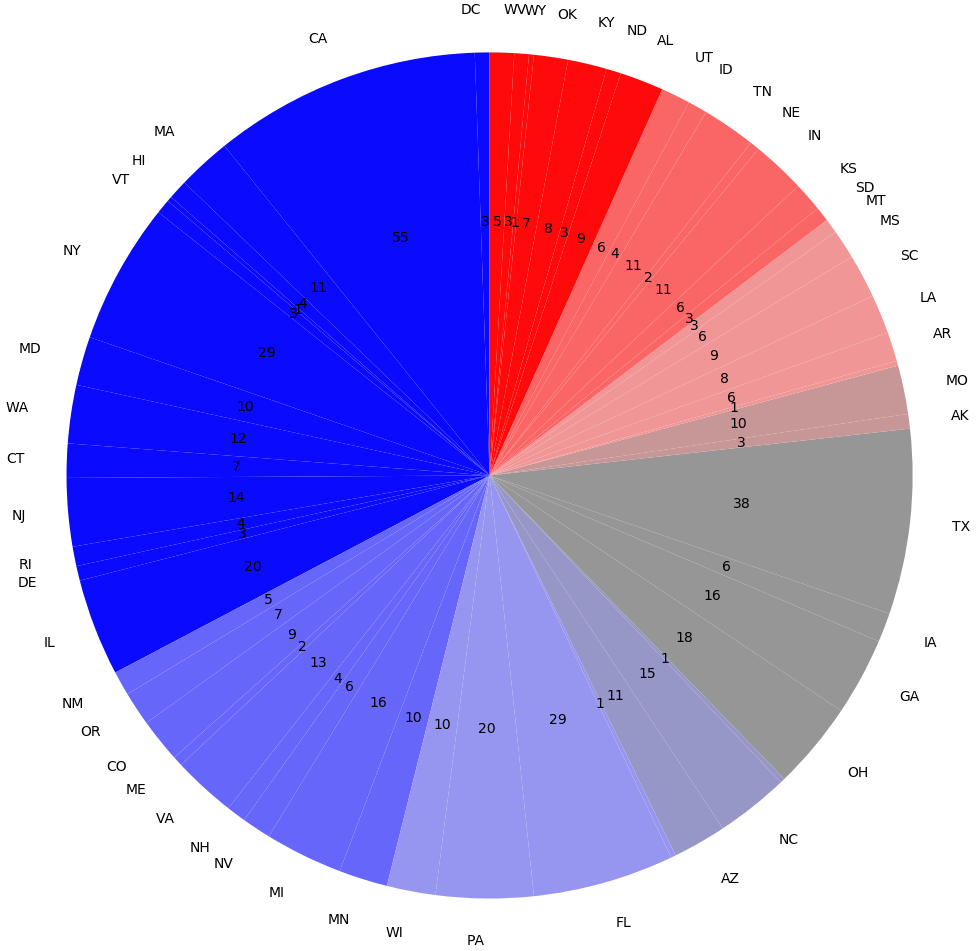
The states in this chart are plotted in order of how well Trump is polling, with his biggest lead being in West Virginia, and his lead in each state diminishing clockwise around the chart. The state at the direct bottom of the circle (6 o’clock) is then the “tipping point state”. This is a term used for the state which provides the winner with their 270th electoral vote. Clearly there is some uncertainty, but at the moment it looks likely that the tipping point state will be one of Wisconsin, Pennsylvania, or Florida. These are therefore the most important states to be watching to determine who is going to win the election. In each of these states Biden’s edge is smaller than his national lead. This difference is Trump’s Electoral College advantage, which currently looks to stand at approximately 1.5 points. That means that Biden would need to win the national popular vote by at least 1.5 points to be the favorite to win. 1.5% is smaller than Trump’s 2.5% structural advantage in 2016, reflecting Biden’s strength as compared to Clinton with non college educated whites who dominate Midwestern swing states.
This Is A Snapshot, Not A Forecast
A crucial point to note is that these are simply polling averages reflecting current public opinion. The election is still quite some time away, leaving ample opportunity for the polls to shift. If the election were tomorrow, it would most likely be a landslide victory for Biden. The possibility that public opinion could change over time is what gives Trump a real shot at winning re-election. At this stage there are still plenty of major events that could swing the election, such as Biden selecting a Vice Presidential nominee (probably Kamala Harris), party conventions, and of course several debates.
There is also an argument to be made that this year public opinion could be more volatile than usual. Sharp shifts in the economy and the Covid-19 situation have already caused polling to fluctuate, and will likely do so again before November, potentially benefiting Trump or Biden significantly. On the other hand, one could argue that in these hyper-partisan times there are few people who are seriously going to change their minds, particularly as almost everyone in the country already has a strong and deeply ingrained opinion of the President one way or the other. So far, national polling has only varied between Biden +6 and Biden +10, with almost no good polling for Trump seen to date.
Overall, it is clear that the national environment remains about as favorable to Democrats as it has for the past 3 years, with Republicans consistently underperforming by 7-9 points. The fact of the matter is that currently the Democratic base is larger than that of the GOP, and most Independents are choosing to vote blue. For Trump to have a serious shot at re-election, something substantial is going to have to change.