There are a lot of conflicting media narratives about the race for the Democratic nomination. Is Biden falling in the polls? Is Warren a “front-runner”? Is Hilary Clinton about to leap into the race and cruise to victory? In such a large and chaotic field engaging in equally numerous and confusing arguments, it can be difficult to see past exaggerated news articles and the biases of those writing them. One way to decode this information is by simply ignoring all the punditry and going straight to the data. That’s why we’ve created a new probabilistic model to provide an overview of how data, not people, predict the primaries are going to go.
Our model draws on polls from dozens of organisations including national and state level research. Combined with data on historic voting patterns and the political similarities of various states, we simulate the primary, including adding random variations to polling averages to model uncertainty. After thousands of simulations, the results are averaged, allowing us to analyse results in individual states and the nation overall.
The headline is that Joe Biden is clearly in the lead. Elizabeth Warren is in second and Bernie Sanders third. That said, pollsters are coming to differing conclusions on the state of the race. Some give Biden double-digit leads on his competitors, others put Warren and Sanders neck and neck or even slightly ahead of the former Vice President. These differences are mainly due to the differing sampling techniques polling organisations employ, and it’s very difficult to say which are more representative of the truth. Our model takes an average of the results, affording more weight to pollsters with strong records and large sample sizes.
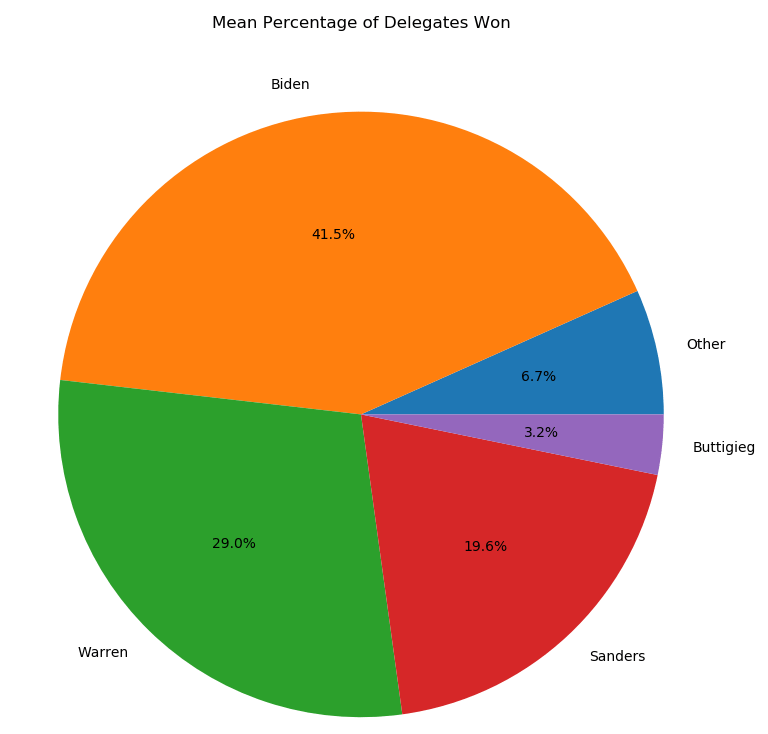
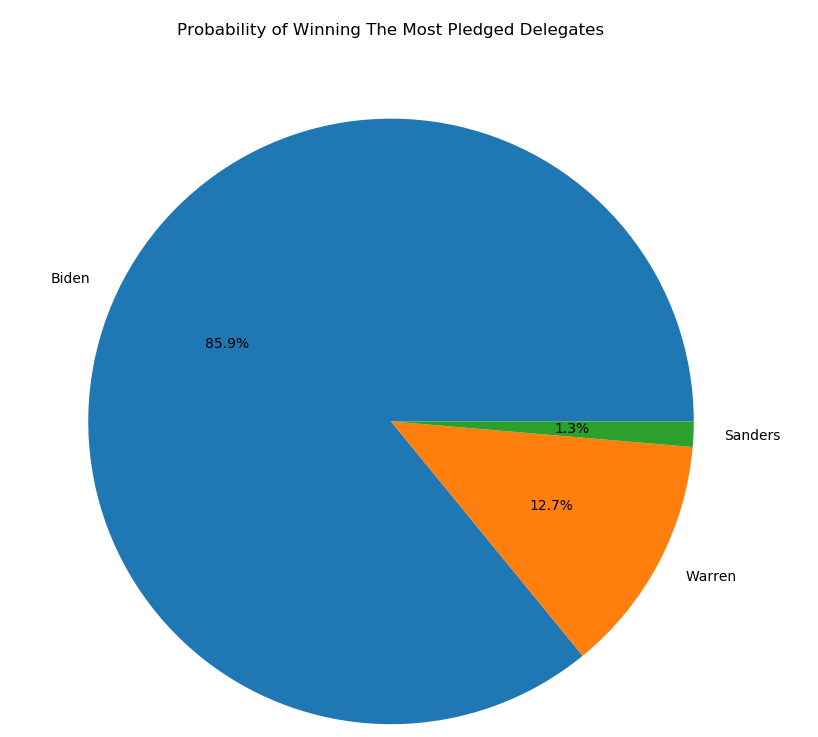
You may wonder why so few candidates are winning a significant number of delegates despite the crowded field. This is down to the all important 15% threshold. Each delegate is attached to either a particular district in a state or to the state as a whole. If a candidate fails to win at least 15% of the vote in a particular district, that candidate receives none of the district’s delegates. If they win less than 15% of the overall state vote, they win none of the statewide delegates. This makes the primary very punishing for anyone but the top three, who are the only candidates consistently polling above the threshold. The chart also demonstrates Biden’s significant lead, which appears even more pronounced when we focus in on how likely each candidate is to win the most delegates.
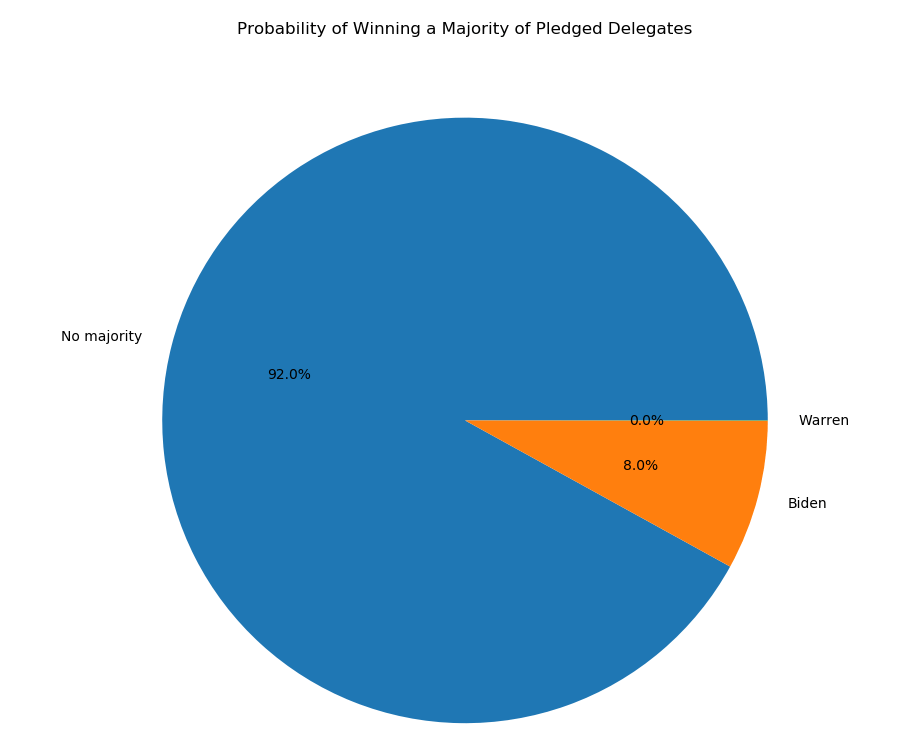
Although he may be winning the most pledged delegates, Biden is still struggling to win an outright majority of them. So long as this is a three horse race that could be a major issue for all the candidates. If nobody controls a majority of pledged delegates by the time the national convention in Wisconsin comes around, superdelegates will get involved. If they can’t push one candidate to an overall majority, there could be an unpredictable brokered convention. This could be quite likely according to the current data, as more than 90% of the time, nobody secures a majority in the first round of voting at the convention.
The chaotic nature of this primary doesn’t stop there though. Iowa and New Hampshire are looking to be highly competitive three or even four way races. Pete Buttigieg is gaining ground in Iowa, reaching second place with 20% of the vote in his best polls. By contrast, Biden is struggling in the two earliest voting states. He could very conceivably come fourth in Iowa and then third in New Hampshire, meaning that even if he does win this primary, it will hardly be a coronation, as he is reported to have been expecting when he joined the race. Our model does simulate voters changing their minds in response to the results of earlier primaries, with our calculations based on voter behavior in previous primaries. However, this year features an exceptionally large number of candidates, and the front-runner coming fourth in Iowa would be unusual, so there is a high degree of uncertainty involved. Therefore it’s important to keep track of simulation results in early states as well as the primary overall.
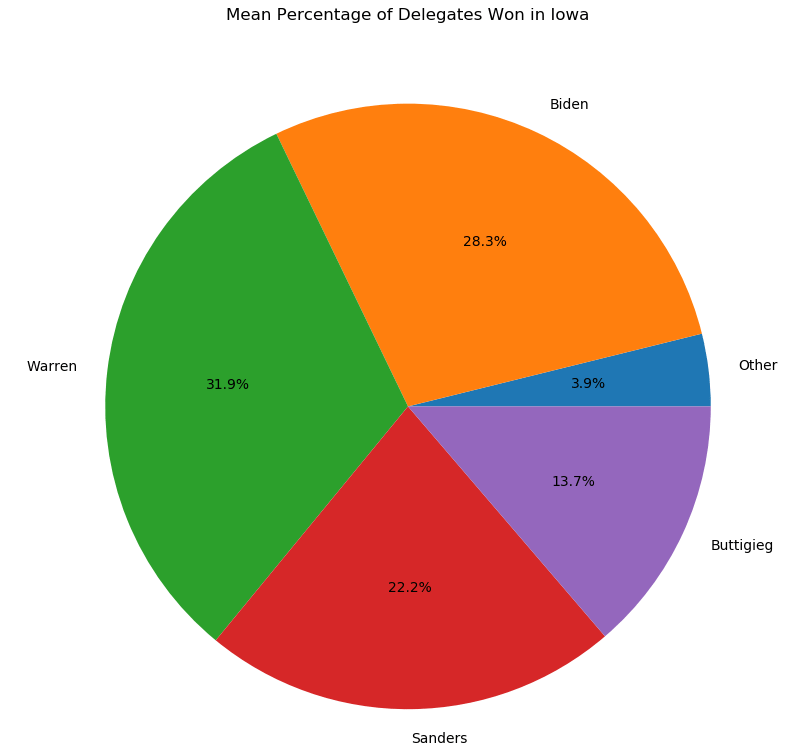
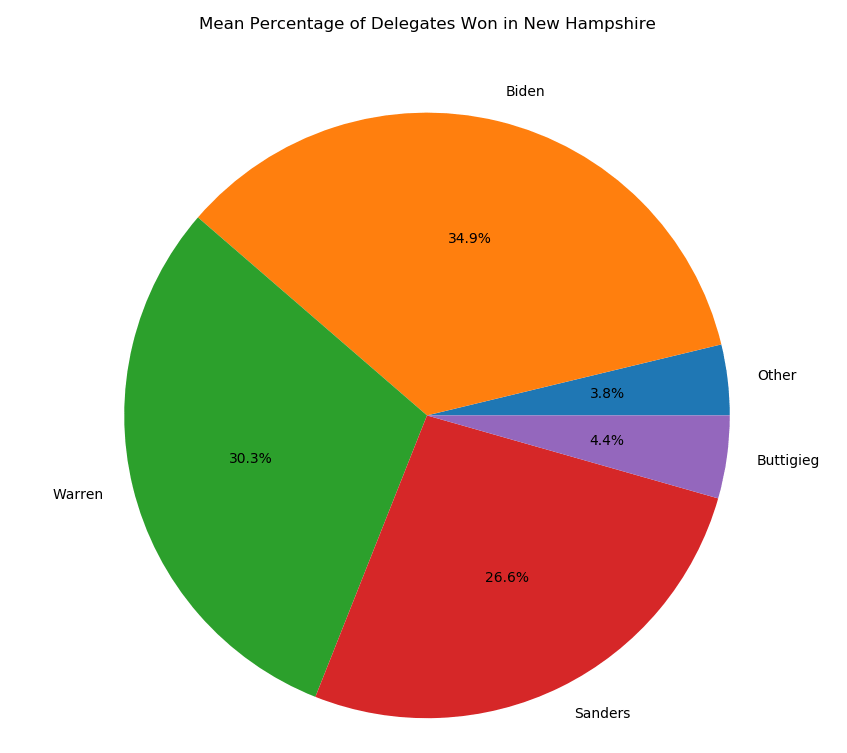
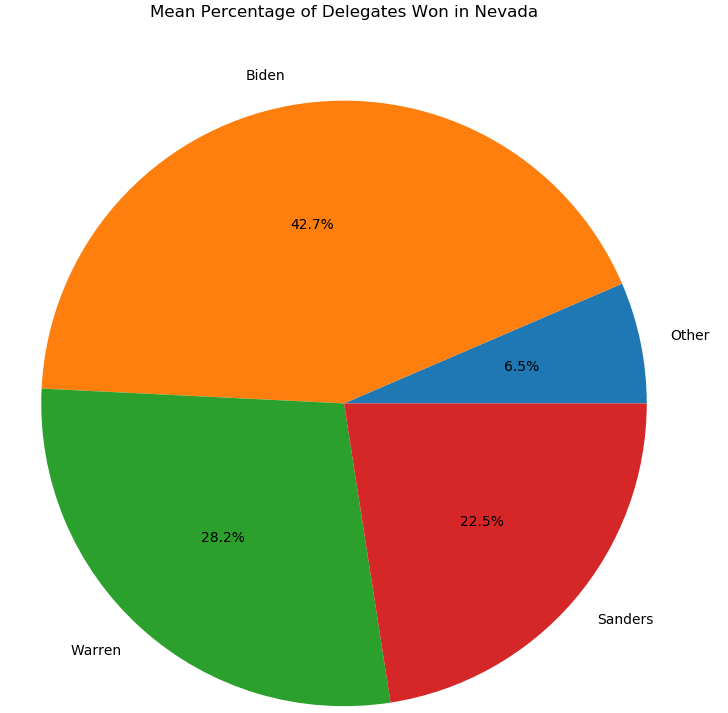
Iowa and New Hampshire are not especially diverse states. Many Democrats there are the white college-educated voters who form Warren and Buttigieg’s bases, explaining their above average performance in these early states. However, the often overlooked but still crucial Nevada and South Carolina also vote before Super Tuesday, when over a third of pledged delegates are assigned, and play a key role in shaping the narrative of the race early on. These two states are a lot more racially diverse than Iowa and New Hampshire, allowing Biden to thrive. In some polls Warren and Sanders are struggling to even reach 15% in South Carolina due to their low support among people of color, a severe problem they face in much of the South.

Overall, the race continues to be a highly competitive affair. But with many candidates struggling to qualify for the December debate it may start to become a little easier to follow. There are surely plenty of twists and turns left, such as Michael Bloomberg considering entering the race. And there’s still everything to play for as the majority of key party figures, such as Obama, are yet to issue endorsements, and most voters are still considering multiple candidates.
