What Biden’s Win Means For The Political Landscape

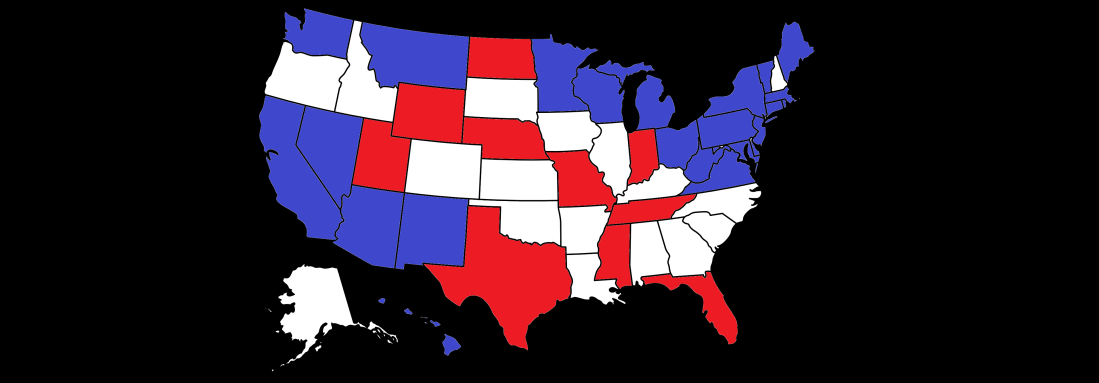
After months of voting, counting, and waiting, the General Election is finally over, and it’s bad news for Republicans. In the end, Biden won the popular vote by a fairly convincing 4.5 point margin. This is substantially less than what most opinion polls were predicting, but was still just enough to bring Biden to a victory. Not only did Democrats win back the key swing states of Pennsylvania, Michigan, and Wisconsin, they also picked up Ariziona and Georgia from the Sun Belt, both of which are extremely promising states for the party moving forward. However, in a sense Biden’s margin of victory was quite narrow, as he won the tipping point state of Wisconsin by just 0.6 points, meaning that Trump’s Electoral College advantage was approximately 4 points. Republicans also seem to be solidifying their control of Florida and North Carolina, quashing Democrats’ hopes in these populous and fast growing states.

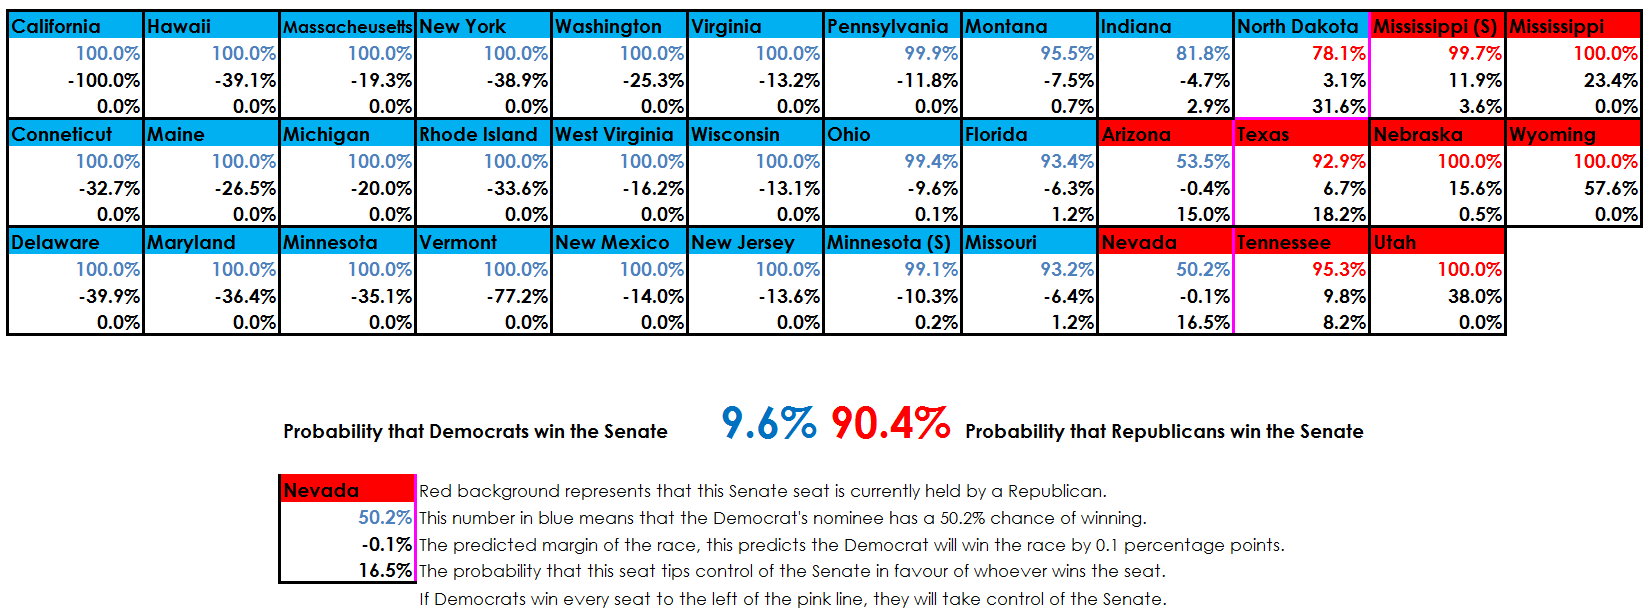
In the Senate, we expected many of the key races to be close. In the end, many of these toss-ups ended up going to Republicans, continuing the trend we see in these results of Democrats underperforming their polls. The GOP held on in North Carolina and Iowa, and unseated Doug Jones in Alabama, demonstrating once again that incumbency is worth much less than party identity in the current political paradigm, making it extremely difficult for Democrats to hang on in red states and vice versa. Indeed, the vast majority of Senate seats once again simply went to the same party that won the Presidential race in that state. Democrats benefited from this trend by picking up seats in Colorado and Arizona, as well as 2 impressive wins in Georgia, giving Democrats the majority in the Senate they so desperately needed. The sole exception to the rule was Republican Susan Collins in Maine, whose moderate reputation allowed her to clinch a narrow victory in a blue state.

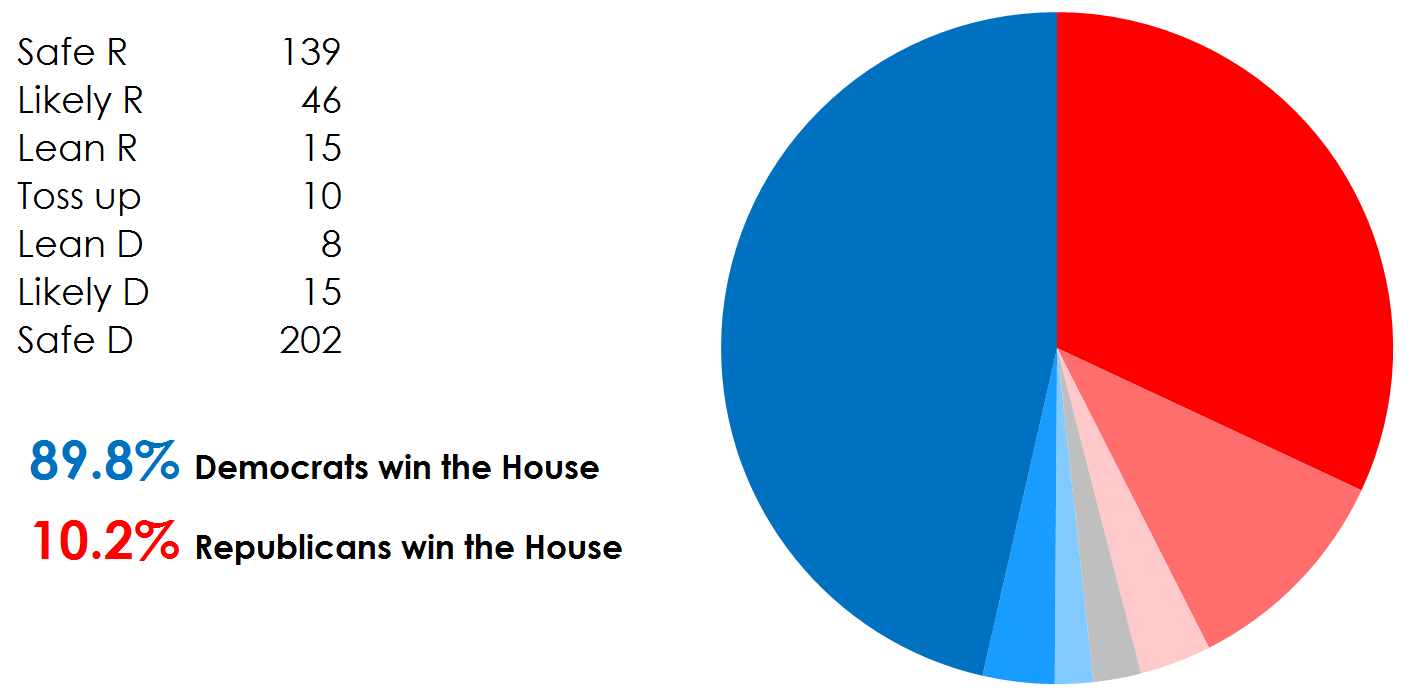
The House was a major source of disappointment for Democrats. While polling indicated the party may enjoy slight gains, instead their majority has been shrunk severely. Those Democrats who remain are a fairly cohesive coalition so should still be somewhat effective, however House votes won’t be the sure thing they once were. Overall across Presidential and Congressional races, we called 98% correctly. Our incorrect calls were all cases of underestimating Republicans, primarily based off inaccurate opinion polling.

Overall, this is a huge win for Democrats. With control of Congress and the White House, they will be able to pass Covid relief bills, implement executive orders, and appoint cabinet secretaries and justices as they please. However, their slim majorities in Congress will likely prevent them from implementing anything radical, as even a couple of Blue Dog Democrats voting against a bill would be enough to block it entirely. Furthermore, they are likely to lose those majorities in the 2022 midterms, meaning they will need to use these 2 years very effectively before Congress becomes split and deadlocked once again.

This election also serves as a vindication of the establishment wing of the Democratic party, demonstrating that mainstream left wing politicians are in fact capable of beating Republicans. This could put the brakes on the Progressive wing of the party, who had previously been arguing that only a radical populist Democrat could excite voters enough to win. It seems likely that in 2024, the Democrats will nominate Biden or Harris for the Presidency, with AOC or any other successor to Bernie Sanders sidelined. Conversely, the GOP may be forced to rethink its strategy. A President failing to win re-election is unusual, as is losing a Senate majority within just 4 years. Whether Republicans stick with Trumpism or fall back to the traditional conservatism of figures such as Mitt Romney will be enormously impactful, and doubtless a major political conflict over the next 4 years.

Finally, Republican structural advantages were cemented and expanded this election, most notably in Trump’s 4 point advantage in the Electoral College, increased from 3 points in 2016. It is entirely possible to envision a scenario where in 2024 or 2028 the Republican nominee wins the Electoral College despite losing the popular vote by 5-10 million ballots. Additionally, the GOP did surprisingly well in State Legislative races, giving them extensive control of the redistricting process coming up in 2021. Meanwhile in many of the states that Democrats do control, they allow the redistricting to be carried out by independent commissions. Ultimately this is likely to mean that Republicans continue to have significant structural advantages in elections for the House and State Legislatures for the next 10 years counterbalancing Democrats’ larger coalition.

Biden’s Lead Is Significant, But Fragile

With the 2020 Presidential election less than 3 months away, high quality polls are being published in large numbers, giving us a clear understanding of the current state of the race. To help sort through this mass of data, we’ve calculated polling averages in all 50 states, DC, and the nation as a whole. These averages take into account the sample size and type of each poll, and each pollsters’ past performance. In states where few polls are conducted, the data used to generate the polling average is supplemented with the national polling average plus the base partisanship of the state.

West Virginia Trump +23.0
Wyoming Trump +20.5
Nebraska 3rd Congressional District Trump +19.2
Oklahoma Trump +17.8
Kentucky Trump +15.1
North Dakota Trump +14.7
Alabama Trump +14.5
Utah Trump +11.2
Idaho Trump +11.2
Tennessee Trump +9.0
Nebraska At Large Trump +8.2
Indiana Trump +8.0
Kansas Trump +8.0
South Dakota Trump +7.9
Montana Trump +7.4
Mississippi Trump +5.7
South Carolina Trump +5.2
Louisiana Trump +5.0
Arkansas Trump +4.5
Nebraska 1st Congressional District Trump +4.3
Missouri Trump +3.7
Alaska Trump +3.0
Texas Trump +0.5
Iowa Trump +0.2
Georgia Trump +0.2
Ohio Biden +1.2
Maine 2nd Congressional District Biden +2.5
North Carolina Biden +2.7
Arizona Biden +3.9
Nebraska 2nd Congressional District Biden +5.2
Florida Biden +5.6
Pennsylvania Biden +6.6
Wisconsin Biden +7.3
USA Biden +7.7
Minnesota Biden +8.0
Michigan Biden +8.2
Nevada Biden +8.3
New Hampshire Biden +9.7
Virginia Biden +10.0
Maine At Large Biden +11.4
Colorado Biden +12.0
Oregon Biden +12.3
New Mexico Biden +12.6
Illinois Biden +14.5
Delaware Biden +14.9
Rhode Island Biden +16.7
New Jersey Biden +17.6
Connecticut Biden +18.0
Washington Biden +20.6
Maryland Biden +21.7
New York Biden +22.3
Vermont Biden +22.9
Maine 1st Congressional District Biden +23.0
Hawaii Biden +26.3
Massachusetts Biden +26.4
California Biden +27.7
District of Columbia Biden +51.9

Biden Leads Nationally And In Swing States

Clearly, these numbers paint a very optimistic picture for Biden, with a 7.7 point national lead. This is a larger lead than Clinton enjoyed at any stage of the 2016 campaign. Additionally, Trump is behind in key swing states, with Biden up 5.6 in Florida, 6.6 in Pennsylvania, 7.3 in Wisconsin, and 8.2 in Michigan. That said it is essential to remember that systematic polling errors do regularly occur. We therefore recommend you expect these averages to be up to 3 points off in either direction. Even with this degree of uncertainty, Biden looks comfortably ahead. His lead only becomes more apparent when the averages are plotted in Electoral College terms as shown in the chart below. Trump is ahead in states worth only about a quarter of the electoral votes, and behind in states worth two thirds, with the remainder being toss-ups.

Pie10Aug

The states in this chart are plotted in order of how well Trump is polling, with his biggest lead being in West Virginia, and his lead in each state diminishing clockwise around the chart. The state at the direct bottom of the circle (6 o’clock) is then the “tipping point state”. This is a term used for the state which provides the winner with their 270th electoral vote. Clearly there is some uncertainty, but at the moment it looks likely that the tipping point state will be one of Wisconsin, Pennsylvania, or Florida. These are therefore the most important states to be watching to determine who is going to win the election. In each of these states Biden’s edge is smaller than his national lead. This difference is Trump’s Electoral College advantage, which currently looks to stand at approximately 1.5 points. That means that Biden would need to win the national popular vote by at least 1.5 points to be the favorite to win. 1.5% is smaller than Trump’s 2.5% structural advantage in 2016, reflecting Biden’s strength as compared to Clinton with non college educated whites who dominate Midwestern swing states.

This Is A Snapshot, Not A Forecast

A crucial point to note is that these are simply polling averages reflecting current public opinion. The election is still quite some time away, leaving ample opportunity for the polls to shift. If the election were tomorrow, it would most likely be a landslide victory for Biden. The possibility that public opinion could change over time is what gives Trump a real shot at winning re-election. At this stage there are still plenty of major events that could swing the election, such as Biden selecting a Vice Presidential nominee (probably Kamala Harris), party conventions, and of course several debates.

There is also an argument to be made that this year public opinion could be more volatile than usual. Sharp shifts in the economy and the Covid-19 situation have already caused polling to fluctuate, and will likely do so again before November, potentially benefiting Trump or Biden significantly. On the other hand, one could argue that in these hyper-partisan times there are few people who are seriously going to change their minds, particularly as almost everyone in the country already has a strong and deeply ingrained opinion of the President one way or the other. So far, national polling has only varied between Biden +6 and Biden +10, with almost no good polling for Trump seen to date.

Overall, it is clear that the national environment remains about as favorable to Democrats as it has for the past 3 years, with Republicans consistently underperforming by 7-9 points. The fact of the matter is that currently the Democratic base is larger than that of the GOP, and most Independents are choosing to vote blue. For Trump to have a serious shot at re-election, something substantial is going to have to change.

Confusion As Iowa Results Delayed

Do you find the Iowa caucus system confusing? Don’t worry, so does the Iowa Democratic Party. It’s the morning after and there are still zero official results. Instead, we have chaos. The Party has failed to provide a thorough or consistent explanation for the absence of results. Reports from Iowa suggest that pretty much everything that could have gone wrong, has.

The key issue seems to be technical problems with an app precincts use to report their results. The technical helpline provided for this app is overloaded, with hold times of more than an hour and some callers being hung up on as soon as they get through to a technician. The backup system for reporting results, based on phone calls, also appears to have collapsed. Additionally there are reports of widespread confusion at caucus sites regarding the process itself, including among some organisers as a result of changes in the system since 2016.

Nevertheless, both the Buttigieg and Sanders campaigns have effectively declared victory, citing anecdotal reports from their own representatives at limited numbers of precincts, and unofficial preliminary results from <2% of precincts from the AP. Meanwhile the Biden campaign is casting aspersions on the legitimacy of the process, perhaps pre-emptively making excuses for what could have been a disappointing night for Biden. The President is also jumping in, insinuating that there exists a conspiracy in Iowa to manipulate the election results. This is one of many misinformation campaigns, with another example being the widespread retweeting of a report of Biden dropping out of the 2008 race, attempting to pass it off as being about 2020.

This is a disaster for Iowa, calling into question the caucus system and Iowa’s traditional position as first in the primary calendar. If Iowa were to switch from a caucus to a primary system, it would fall victim to a New Hampshire state law requiring the state to always have the earliest primary. This year, we can expect Iowa’s influence to be significantly decreased due to the confusion and mixed messages. This is probably good news for Biden, who was comparatively weak in Iowa, and disastrous for candidates such as Buttigieg and Klobuchar who built their entire campaigns on winning Iowa. We could now see New Hampshire become the most important state in the primary, and the power of Nevada and South Carolina magnified dramatically. Sanders particularly could stand to benefit due to his strength in New Hampshire, but this is uncharted territory, so the exact impact of tonight’s debacle is unpredictable.

For now, we recommend that you don’t take any of the currently available data seriously. Entrance polls, photos of caucuses, campaigns releasing their own biased estimates, and preliminary results from a tiny proportion of precincts are all very weak data points. We are going to have to wait for the final, official results. Thankfully, there is a paper trail for the caucuses. Therefore, if the worst comes to the worst, the Party can painstakingly recount every vote and eventually arrive at accurate, reliable results. Campaigns have been told that results should be released later today, but at this stage there’s really no telling whether or not that will happen.

The Iowa Caucuses

Today is the single most important day in the Democratic Primary. Although just 41 pledged delegates are up for grabs tonight, the results and their interpretation will have knock on effects on the rest of the country.

Iowa Predictions

Current Iowa polling shows Sanders and Biden effectively tied with 23% and 22% of the vote respectively. Buttigieg and Warren have each fallen to approximately 15%, while Klobuchar has surged to 11%. However, a naive assessment of these first choice preferences is insufficient in understanding who might win, Iowa is much more complex than that. For each local caucus, candidates who receive 15% or more of first choice preferences immediately bank those votes. However, people who initially supported candidates with less than 15% of the vote will have one opportunity to realign. They could vote for candidates who have already passed the threshold, they could simply go home, or they could support other candidates below the threshold to try and get them up to the 15% mark.

The impact of this system is that second preferences become immensely important. Bear in mind that Iowa voters are generally exceptionally well informed on the candidates due to the intensity of campaigning there, so many will have a well thought out list of preferences. Generally speaking, the field could be sorted into a moderate lane dominated by Biden and Klobuchar and a progressive lane dominated by Sanders and Warren, with Buttigieg in the middle. One would expect voters’ second choices to be from the same ideological lane as their first choice. Campaigns have explicitly reached out to one another to encourage their supporters to select each other as their second choices. The voters themselves will be in the room attempting to convince those realigning to come and support their candidate, all of which makes the process very challenging to predict.

Further complicating matters is the system of delegate allocation, with just 14 delegates being awarded based on the statewide popular vote, and the remaining 27 split between Iowa’s 4 congressional districts. Not only will the allocation be related to the candidates’ popularities in a non-linear manner due to the system of realignment and the 15% threshold, but some of the delegate allocation will be very approximate. Delegates afterall, are people, no candidate can win half a delegate, so the resolution of the system is very low. For example, the 4th congressional district has just 5 delegates, so candidates with very different vote totals could receive the same number of delegates. Furthermore, a candidate with only a few more votes than a competitor could just pip them to the post for an extra delegate, winning far more representation despite having similar vote totals. Currently, our model is predicting that on average, Sanders will win the caucus with 14 delegates. He will be followed by Biden with 12, Warren and Buttigieg with 6 each, Klobuchar with 2, and another candidate with 1, most likely Yang or Steyer.  It is worth noting that these predictions come with a very high degree of uncertainty owing to the complexity of the process.

Media Narratives

This year, for the first time, Iowa will release 3 sets of results. Historically, Iowa simply released the number of delegates allocated to each candidate. However, this year, both the first preference totals and the votes after realignment will be released. It is entirely plausible that these metrics will not all be won by the same candidate, potentially resulting in 2 or even 3 candidates declaring victory tomorrow! Whether or not that happens, the media narrative regarding the results will guide the public interpretation of them. This is not trivial, it is the public interpretation of the Iowa results, especially in terms of tactical voting and changing perceptions of which candidates are electable, which makes Iowa so important. Essentially, it doesn’t help a candidate much to win 13 delegates instead of 12, what matters is whether or not CNN declares them the winner.

Typically, the winner in Iowa receives a substantial bump in the polls. This might be more complicated this year due to potential disagreement over who the “winner” is, but remains electorally crucial. The popularity boost the winner gains is usually greater if they were not expected to win, indeed it may be more useful to consider each candidate’s performance not against one another, but against the respective expectations of each candidate. Currently, the media narratives are effectively, as ever, following intelligent averages of the polls but not accounting enough for uncertainty. Hence Sanders is broadly expected to win a narrow victory over Biden, and Buttigieg has largely fallen out of media coverage. In fact, it is still perfectly likely that any of the top four candidates could win in Iowa, although Sanders does have the best chance. High expectations of Sanders could limit the boost he receives should he win, whereas the potential upside for Buttigieg is massive, something he is counting on given his weak national polling.

Finally, candidates for whom expectations are very low can gain in the polls simply by coming second or third, exceeding expectations. This is effectively what Klobuchar is banking on. With 3 different sets of results it is also plausible that multiple candidates will be clamouring to claim second or third place. As you can probably tell, this is all becoming rather confusing and far too complicated to fit into a typical TV news segment. The manner in which journalists navigate this sea of information, and the spin candidates put on the results, will have a profound impact on the remainder of the primary.

Introducing Our 2020 Democratic Primary Model

There are a lot of conflicting media narratives about the race for the Democratic nomination. Is Biden falling in the polls? Is Warren a “front-runner”? Is Hilary Clinton about to leap into the race and cruise to victory? In such a large and chaotic field engaging in equally numerous and confusing arguments, it can be difficult to see past exaggerated news articles and the biases of those writing them. One way to decode this information is by simply ignoring all the punditry and going straight to the data. That’s why we’ve created a new probabilistic model to provide an overview of how data, not people, predict the primaries are going to go.

Our model draws on polls from dozens of organisations including national and state level research. Combined with data on historic voting patterns and the political similarities of various states, we simulate the primary, including adding random variations to polling averages to model uncertainty. After thousands of simulations, the results are averaged, allowing us to analyse results in individual states and the nation overall.

The headline is that Joe Biden is clearly in the lead. Elizabeth Warren is in second and Bernie Sanders third. That said, pollsters are coming to differing conclusions on the state of the race. Some give Biden double-digit leads on his competitors, others put Warren and Sanders neck and neck or even slightly ahead of the former Vice President. These differences are mainly due to the differing sampling techniques polling organisations employ, and it’s very difficult to say which are more representative of the truth. Our model takes an average of the results, affording more weight to pollsters with strong records and large sample sizes.

PC Dels Won

You may wonder why so few candidates are winning a significant number of delegates despite the crowded field. This is down to the all important 15% threshold. Each delegate is attached to either a particular district in a state or to the state as a whole. If a candidate fails to win at least 15% of the vote in a particular district, that candidate receives none of the district’s delegates. If they win less than 15% of the overall state vote, they win none of the statewide delegates. This makes the primary very punishing for anyone but the top three, who are the only candidates consistently polling above the threshold. The chart also demonstrates Biden’s significant lead, which appears even more pronounced when we focus in on how likely each candidate is to win the most delegates.

Most Pledged Dels

Although he may be winning the most pledged delegates, Biden is still struggling to win an outright majority of them. So long as this is a three horse race that could be a major issue for all the candidates. If nobody controls a majority of pledged delegates by the time the national convention in Wisconsin comes around, superdelegates will get involved. If they can’t push one candidate to an overall majority, there could be an unpredictable brokered convention. This could be quite likely according to the current data, as more than 90% of the time, nobody secures a majority in the first round of voting at the convention.

Majority Pledged Dels

The chaotic nature of this primary doesn’t stop there though. Iowa and New Hampshire are looking to be highly competitive three or even four way races. Pete Buttigieg is gaining ground in Iowa, reaching second place with 20% of the vote in his best polls. By contrast, Biden is struggling in the two earliest voting states. He could very conceivably come fourth in Iowa and then third in New Hampshire, meaning that even if he does win this primary, it will hardly be a coronation, as he is reported to have been expecting when he joined the race. Our model does simulate voters changing their minds in response to the results of earlier primaries, with our calculations based on voter behavior in previous primaries. However, this year features an exceptionally large number of candidates, and the front-runner coming fourth in Iowa would be unusual, so there is a high degree of uncertainty involved. Therefore it’s important to keep track of simulation results in early states as well as the primary overall.

Iowa

NH

Iowa and New Hampshire are not especially diverse states. Many Democrats there are the white college-educated voters who form Warren and Buttigieg’s bases, explaining their above average performance in these early states. However, the often overlooked but still crucial Nevada and South Carolina also vote before Super Tuesday, when over a third of pledged delegates are assigned, and play a key role in shaping the narrative of the race early on. These two states are a lot more racially diverse than Iowa and New Hampshire, allowing Biden to thrive. In some polls Warren and Sanders are struggling to even reach 15% in South Carolina due to their low support among people of color, a severe problem they face in much of the South.

Nevada

SC

Overall, the race continues to be a highly competitive affair. But with many candidates struggling to qualify for the December debate it may start to become a little easier to follow. There are surely plenty of twists and turns left, such as Michael Bloomberg considering entering the race. And there’s still everything to play for as the majority of key party figures, such as Obama, are yet to issue endorsements, and most voters are still considering multiple candidates.

What The 2019 Election Results Do and Don’t Tell Us

The votes are in, and the headlines are big wins for Democrats in Virginia, where they took full control of state government, and Kentucky, where they overcame partisanship to win a gubernatorial race in one of the reddest states in the country (albeit by just half a point). But Republicans did manage to hold on to full control in Mississippi, and conservatives saw some success in ballot measures. Naturally there are already a huge variety of hot takes on what this all means, let’s break the main ones down one by one.

This was a good night for Democrats

True. Across the board, Democrats significantly overperformed the partisanship of their districts and states by an average of 5 points, with that advantage rising  to about 9 points in races with no Republican incumbent. These figures approximately match other indicators of the mood of the electorate, such as the congressional generic ballot showing Democrats 6-7 points ahead. Additionally, polls pitting theoretical Democratic Presidential nominees against Trump show 5-7 point leads for Warren and Sanders, with Biden holding an even greater lead. All in all Democrats can rest easy that the national environment is distinctly blue, although not quite as blue as it was in 2018, when Democrats won the House popular vote by 8 and a half points. Furthermore, Democrats and left-leaning Independents are clearly highly motivated, displaying very high turnout for an odd year election. In future analysis we should be operating with the prior assumption that something significant has to change before Republicans can dream of winning the popular vote.

The results show Trump will lose re-election

False. Elections this far away from Presidential races simply are not good indicators of voting intention so far in the future. For example, Democrats suffered heavy electoral defeats throughout Obama’s first term, yet he went on to win re-election fairly comfortably. With Trump himself on the ballot, perhaps Republican turnout will rise to match that of Democrats. Or maybe Democrats will fail to convince the nation that Trump should be impeached, yet still go ahead and impeach him. The Democratic nominee could be perceived negatively, perhaps for extreme left wing positions in Warren’s case, or old age in Biden’s. And don’t forget the Electoral College which in 2016 gave Trump an advantage of about 2 and a half points, and the political wisdom that incumbent Presidents typically win re-election. If anything, the takeaway here is that 2020 will be very competitive.

2020 turnout will be at a record high

True (probably!) We’ve now seen exceptionally high turnout in both 2018 and 2019, with many of last night’s elections showing higher turnout than the 2014 midterms. All the data points suggest a deeply politically engaged electorate who are keen to come out and vote, especially for or against the President. Healthcare, immigration and gun control also appear to motivate voters a great deal, and there will be enormous contrast between Democratic and Republican policy on all three of these issues, regardless of who Democrats nominate. 2020 turnout in excess of 70% (compared to 55% in 2016) is entirely plausible. Who this would benefit is another question. Ethnic minorities and young voters are the traditional low turnout demographics. If increased electoral engagement is driven by these groups then Democrats could be at a big advantage. That said, every demographic has room for turnout to increase substantially. This is a case where the details are everything.

Split ticket voting is alive and well

False. Sure, Kentucky voted for a Democratic governor, yet voted against Democrats down the ballot by margins of around 20 points. But this really was an exceptional case, on par with Roy Moore’s ill-fated 2017 bid for an Alabaman Senate seat. Matt Bevin was the least popular governor in the country, with a net approval rating of about -25, and a net approval of only +11 points among Republicans. He won just 52% of the vote in his primary and is infamous for putting both of his feet in his mouth at once, for example when he “guaranteed” that children in Kentucky were being sexually assaulted as the result of a teacher strike. Overall in recent elections there is very little evidence of significant ticket splitting, and in 2020 we should expect the vast majority of voters to vote the same way in all races.

Mitch McConnell’s re-election is at risk

False. We can be fairly sure that the Senate Majority Leader won’t be losing his seat in 2020. He is certainly a remarkably unpopular senator given the partisanship of Kentucky, with approval ratings comparable to those of Bevin. But the crucial difference is that McConnell is up for re-election in a presidential year. All the media attention will be on the presidential race, and Trump’s presence at the top of the ballot will help out any struggling Republicans in red states. In 2016, every state voted the same way for the Presidency and the Senate. In 2018, we saw further evidence that party identification is becoming a much more important factor than the specific person running for office, especially in federal races. We should therefore continue to assume that so long as Kentucky is safe for Trump, it’s safe for McConnell.

One last thing: Democrats now control the entire Virginian legislative and executive branches, will they seek to aggressively gerrymander Virginian seats in their favor? Before they came into power in the state, Democrats vigorously supported a bill seeking to create an independent redistricting commission. That bill has now made quite a bit of progress, but its successful passage would prevent Democrats from capitalizing on their gains in 2019 to draw maps designed to elect as many Democrats as possible. So the question is, will they hold fast to their established anti-gerrymandering position, or will 10 years of massive electoral advantages be too great a temptation to resist?


Why The 2019 Elections Matter

Today’s elections may not be for the Presidency or Congress, but they will still have a profound effect on the lives of millions. In addition to a wealth of local elections there are also competitive gubernatorial races in Kentucky and Mississippi, and every seat in the Virginia state legislature is up for grabs. Even if you don’t live in any of these states, here’s why it’s still worth keeping an eye on today’s races:

Redistricting

The next round of redistricting is coming up in 2021 following the 2020 census. This provides an opportunity for state governments to redraw the boundaries for both their own seats and congressional districts. Following Obama’s election in 2008, Republicans came back with a vengeance in 2010, winning control of a large number of governorships and state legislatures. In the following round of redistricting, many state governments completely controlled by Republicans chose to take this opportunity to draw maps designed to elect more Republicans. Some states entirely controlled by Democrats did the same, but the overwhelming GOP victory in 2010 meant Republicans were able to obtain advantageous electoral maps across the country, leading to them winning a majority in the House of Representatives in 2012 despite losing the popular vote.

In the hyper-polarized modern political climate, it is unlikely either party will have mercy if they control the majority of state legislatures after 2020. That means every state level election for the next two years has significant effects on the following ten years of elections. In Kentucky and Mississippi, Republicans are fighting to hold on to governorships such that they can maintain total control of state government. This is crucial as governors can veto redistricting proposals in their state, so a Democratic governor could prevent Kentucky from maintaining 5 out of 6 congressional seats as easy Republican wins. In Mississippi, the current maps pack so many of the state’s Democratic voters into one district that in 2018 Republicans didn’t even field a candidate there, while Republicans win each of the remaining seats by very comfortable margins.

In Virginia, Democrats need only marginal gains in each chamber of the General Assembly to take full control of state government. Here Democrats will be most eager to redraw the boundaries for state level elections after failing to take back the House in 2017 despite winning the popular vote by a large margin. With eleven congressional districts, a state government fully controlled by Democrats could also significantly influence the state’s future congressional delegations, should they decide to be ruthless.

Looking Ahead

These elections will also serve as perhaps the first high quality data points since the midterms towards predicting the results of the 2020 elections. Presidential election polls at this point in the race still tend to have approximately twenty point margins of error, but these are actual elections with real votes. Which demographics are sufficiently enthusiastic to turn out and how those groups vote inform our understanding of the current national environment, and will help political parties analyse which groups they need to target.

Clearly, if Democrats can win a gubernatorial race in just one of Kentucky, which on average leans 24 points towards Republicans, and Mississippi which leans 15, it is a very good sign for them, proving they can compete in even the most deeply conservative states. However despite much media attention, it seems unlikely that either of these governorships will actually go blue. Kentucky’s Republican governor Matt Bevin is deeply unpopular, but the state is simply too conservative for him to be anything but the frontrunner. Nevertheless, that one could be close. In Mississippi, it is much more feasible that the Democratic nominee Jim Hood could win the popular vote, but in Mississippi things are not so simple. In order to win the race, Hood also needs to win in the majority of the districts that make up the state House of Representatives. But these seats were gerrymandered by Republicans in 2011, so there’s next to no chance he succeeds. If Hood does win the popular vote but not the majority of districts, the large Republican majority in the state House gets to pick the winner, which would inevitably be the Republican candidate Tate Reeves. As a result, the real thing to watch for in these races is not the winner, but rather the margins by which the popular vote is won or lost.

The results in Virginia are crucial in their own right, giving strong indications toward how this swing state might vote in 2020, as well as whether its even more important neighbor North Carolina’s fifteen electoral votes might be in play for Democrats. This will also serve as a test of how hard a series of significant scandals have hurt Democrats in Virginia, where recently two out of three top Democrats were found to have worn blackface and the third was accused of sexual assault.

All this said, tomorrow morning there are going to be a lot of takes on how 2019 informs us about 2020 and Trump’s popularity. Take these with several generous pinches of salt. Between now and the presidential election we have a whole year, a general election campaign, the selection of the Democrat’s nominee, a final vote on impeachment, and most likely a senate trial of the President. Tonight’s results are probably not going to be all that reflective of 2020, they simply serve as a starting point for our analysis of the coming elections.

Is The Electoral College Racist?

Back in August, Rep. Alexandria Ocasio-Cortez posted an Instagram story criticizing the Electoral College, calling it “a scam”. She went on to claim that “the Electoral College has a racial injustice breakdown. Due to severe racial disparities in certain states, the Electoral College effectively weighs white voters over voters of color, as opposed to a ‘one person, one vote’ system where all our votes are counted equally.” Unsurprisingly, her comments faced severe criticism from the right, which railed particularly strongly against the accusation that the Electoral College is racist.

So is it true that this institution makes white votes more powerful than others? Well, this is something we can test. We ran fifty-thousand simulations of presidential elections featuring a generic Republican facing down a generic Democrat. From these, we determined how much of a swing state each state is, and multiplied by their number of electoral votes to create a rating of how powerful each state is in presidential elections. Dividing this rating by the number of voters in the state gives us an index of how powerful each individual vote is. But this isn’t the full picture.

The concept of “wasted votes” is the main metric being used to assess gerrymandering today, that being the practice of drawing district boundaries to the benefit of one party over the other. Two techniques are used to achieve this: “Packing” and “cracking”. Packing is where you draw a district to lean as strongly as possible in favor of one party, packing all their voters into this one district such that the party is far less competitive in every other race. Cracking is where you spread a party’s voters out evenly between many districts such that they make up 40-45% of the population in every race. Therefore even though that party’s voters may make up almost half the population, they win none of the elections.

In the below example, green voters have been packed into one district and cracked across the rest, resulting in the purple party winning 5 out of 6 elections despite having only as many voters as the green party.

Gerrymandering Example

The wasted votes system counts any votes cast for a losing candidate as wasted. Therefore if most elections are being won by the same party by small margins, a huge number of the other party’s votes will be judged as wasted, effectively detecting cracking. Additionally, votes cast for the winning candidate above the 50% they need to win the election are also judged as wasted. This detects packing, as if a candidate wins a huge proportion of the vote, a large number of their votes will be wasted.

Applying this to our analysis has a profound effect on the results, leaving only the votes that make an impact on the election. For example, Republican votes in Upstate New York are discounted as these Republicans are not represented at all in the Electoral College. Additionally, many Democratic votes used to build up enormous margins in New England are treated as wasted as you don’t get any more electors for winning by 30% than by 1%. This leaves us with a clear picture of which votes count, and how much they count for. By studying the race of each voter, this information is used to calculate the average power associated with a white, black, Hispanic, and Asian vote.

The results of this are striking. On average, white votes are worth 1.13 times the average vote. Black and Hispanic votes are each worth 0.81 times the average, and Asian votes just 0.75 times. This can be attributed to a few factors. Firstly, the all important Midwestern swing states (Michigan, Wisconsin, Ohio, Pennsylvania, Minnesota, Iowa) are disproportionately white. Also, many non-white voters are packed into big cities in safe Democratic states like California, such that many of their votes are wasted running up the score in landslide elections. Additionally, many black voters are “cracked” across the South, forming large minorities which can never muster up quite enough votes to win the state.

To understand better how the disparity in representation arises, we can look at which states are the main sources of each race’s voting power. White voters are fairly evenly distributed, so the breakdown for white voters shows the main sources of their voting power being the key swing states around the country, the only surprise being the increasingly competitive Texas.

W

By contrast, black voters are much more concentrated in the South, and so their voting power is much more dependent on Florida, perhaps the only really competitive Southern state. However black voters are also able to exert their influence in Virginia, where since the Obama era they have formed the basis of a slim but surprisingly sturdy Democratic majority. Georgia and North Carolina also score highly as a result of large ethnic minorities coming increasingly close to flipping these states in what would be a major coup for Democrats. Interestingly, large black populations in Alabama, Mississippi, South Carolina, Louisiana and Tennessee wield very little power in the Electoral College as they almost all vote Democrat, but these states never go blue.

B

Hispanic voting power is even more concentrated, with five states providing over half their electoral influence. Texas and Florida each provide 16% of their voting power, with most of the key swing states having only small Hispanic populations. The importance of their role in Texas cannot be overstated. Although the Texas GOP may lose Hispanic voters by large margins almost all the time, the fact that these margins are closer to 50 points than 90 means Republicans are still able to win in this racially diverse state. In other words, it doesn’t just matter whether you win or lose a demographic, the exact margin is crucial. Arizona, a new swing state, is another key source of Hispanic voting power, and is sure to be getting a lot of attention in 2020.

H

Finally, many Asian voters are packed into coastal cities in deep blue states, with very little presence in any swing state, resulting in their minimal electoral influence and the absence of any concerted efforts to win them over.

A

This analysis suggests that AOC is probably correct at least in her assertion that due to the Electoral College, white votes count for more than those of voters of color. There is also potential for this to be reversed in the future, as increasing non-white populations in Texas, Arizona, Florida, North Carolina and Georgia could make these states increasingly competitive, and perhaps even turn them reliably blue as has happened in Virginia. But for now, tens of millions of Americans are forced to live with the reality that their vote has little to no impact, and this disempowered group is disproportionately non-white.

What The Midterms Results Tell Us About Politics

The madness of the midterms is over, and the results are pretty much as expected, with Republicans building up their Senate majority but losing the House. In fact, of the races called so far, our model correctly predicted the overall results of 97.2% of them. We predicted a Senate result of 48 Democrats to 52 Republicans, very close to the probable final result of 47-53. The House model gave a similarly accurate prediction of 239-196, against the probable final result of 234-201. At first the night looked tough for Democrats, with mixed early results in Florida, a slight surprise in the defeat of Indiana Democratic Senator Joe Donnelly, and the defeat of Amy McGrath in Kentucky’s 6th congressional district. These early results seem to have played an outsized role in forming the narrative of the election, that of a good but still disappointing night for Democrats. But make no mistake, this was a blue wave. Democrats successfully competed in suburbs to win a solid majority in the House, won the popular vote by a wide margin (about 8 points), and did surprisingly well in the Senate given that this year’s map was very good for Republicans.

The next most significant takeaway is probably that incumbency matters much less than it has in the past. America voted along partisan lines to an unprecedented extent, with very little ticket-splitting. The highest profile casualties of this were Democratic Senators in the red states of Missouri, Indiana, and North Dakota. Even in Montana and West Virginia where the Democratic Senate incumbents won, they did so by surprisingly small margins, and in Florida, which isn’t even that red, Republican Rick Scott beat Democratic incumbent Bill Nelson. By the way, watch out for Rick Scott in 2024, a popular and seasoned Governor come Senator from a swing state, whose term is ending in a Presidential year, is definitely someone to be aware of when the rumours about who’s running for President start to circulate.

Next, voter engagement was off the charts, with a turnout of 49%, the highest midterm turnout since 1914! This isn’t even much lower than the 56% turnout for the Presidential race in 2016. Of course these numbers are still very low compared to most Western democracies, but if this trend holds it seems perfectly plausible that we see extraordinary turnout in 2020 when the fate of Trump’s Presidency will truly be in play, 70% turnout begins to seem perfectly possible.

Thirdly, healthcare is by far and away the most prominent issue in politics right now. Democrats built their campaign on protecting the healthcare system, and to some extent it drove their victory, as it seems to be an argument they are winning – in a recent poll, 44% of those sampled said they trusted Democrats more on healthcare, compared to just 34% for Republicans. The next most important issue was immigration, perhaps unsurprisingly given Trump making a migrant caravan in Mexico a prominent issue during the final days of the campaign. These were followed by the economy, then gun control. It’s likely that these are the issues that will shape the elections in 2020, as politicians can see the incredible extent to which they have engaged the public. An economic downturn could spell the end of the Trump Presidency, or continued growth could form the basis of his re-election campaign. And it seems beyond doubt that the Democratic nominee will make healthcare a major talking point, and bring it up as often as they can.

Thinking about 2020, 2018 taught us a lot about what the electoral map is going to look like in 2 years time. Minnesota, Michigan, Wisconsin and Pennsylvania all veered away from Republicans, while Democrats enjoyed little joy in the Sun Belt. The Sun Belt is a collection of Southern and South-Western states which lean Republican, but Democrats dream of turning blue by turning out large ethnic minorities. The Sun Belt usually means Florida, North Carolina, Arizona, and sometimes Georgia and Texas too for the more ambitious Democrats. The best path to victory for Democrats in 2020 is now clearly via the Upper Midwestern states, which gives extra weight to Joe Biden and Amy Klobuchars’ potential Presidential campaigns, as they both have proven ability to appeal to Midwestern voters. But don’t discount Beto O’Rourke. He may have lost, but in a way that’s good for him, he now has more time to build up his campaign infrastructure, visit the early primary states, and prepare for another battle. He lost by a surprisingly small margin of only 2.6 points, and managed to electrify and thrill the Democratic base in a way that no one has really done since Obama. Add that to extraordinary fundraising abilities, and you have a very very strong contender for the Presidency.

Final Midterm Forecasts

The election is now almost here, and the final RedvBlue forecast is interesting but overall fairly clear and decisive. The top line is that Democrats have about a 10% chance of winning control of both chambers of Congress. The Republicans have a similar chance of full control, and in the remaining 80% of cases, the Democrats will win the House, but the Republicans will hold onto the Senate.

Warning: The approximately 10% chance that Democrats win the Senate and the 10% chance that Republicans win the House are very real. This means that if the election ran a hundred times, we would expect these things to happen about 10 times each. This election is not a dead certainty, and elections are nothing if not surprising, so be prepared!

The Senate

4_11predictions

Republicans Ted Cruz and Marsha Blackburn of Texas and Tennessee respectively seem to have successfully fended off fierce challenges from Democrats, and are looking confidently ahead in the polls. The bad news for Republicans is that the Democratic incumbents in deep red states seem to have largely consolidated their positions. West Virginia and Montana look remarkably safe for Democrats, and though the model’s predictions in Missouri and Indiana are nowhere close to certain, the GOP seems significantly behind in both. Only North Dakota has proven vulnerable to Republican efforts to make gains, but this may very well be enough. The highly competitive races remaining in the Senate are Nevada, Arizona, and North Dakota, and Democrats need all 3 to win a majority. Nevada and Arizona are now almost perfect 50:50 toss-ups, it’s really anybody’s guess who’ll win those. But the two states are relatively similar, so it’s reasonable to imagine that they’ll both choose the same party. Meanwhile Democrats need Heidi Heitkamp to pull off a small miracle in North Dakota in order to secure the seat, which has been looking increasingly vulnerable as the election has progressed.

Due to tiny Democratic leads in Nevada and Arizona, going on a seat by seat basis the model predicts that the composition of the Senate will become 50-50, with Vice President Mike Pence giving Republicans the casting vote. But due to the high exposure of several red state Democrats, and very low exposure of the GOP, the average prediction given by the model is that Republicans will come out of the midterms with 52 Senate seats, against only 48 Democrats. The most likely scenario in which this happens would be that Republicans win in North Dakota, Nevada and Arizona.

The House

4_11predictions2

By contrast, the Republicans would need a small miracle to win in the House. Democrats need 23 gains to take control, and New York, California, and New Jersey put together provide almost enough competitive races to allow for that on their own. Democrats are looking great in the New York seats, and in California they’re assisted by there not even being a Republican on the ballot for the Senate race, potentially causing some Republican voters to not bother turning out. However, Democratic Senator Robert Menendez of New Jersey is looking unusually weak this year, having been caught up in a significant scandal, this might weaken Democratic chances across the state. But then there are simply so many other good options for the party to pick up the seats they need. Democrats are looking much stronger across the Midwest than they did in 2016, and Pennsylvania and Minnesota are both heavily laden with competitive districts. On a seat by seat basis, the model predicts the House will go 231-204 in favour of Democrats, representing a net gain of 36 seats. In the House it’s Republicans who are heavily exposed, so the average net gain predicted by the model is 44 seats, leading to a 239-196 House composition, a strong Democratic majority.

Predictions In Full

Here is a full list of our final calls. Although some of these races are toss-ups, this is who we think would win in each race if we had to choose.

Senate – Democratic Wins (Includes Independents who caucus with Democrats)

Arizona, California, Connecticut, Delaware, Florida, Hawaii, Indiana, Maine, Maryland, Massachusetts, Michigan, Minnesota, Minnesota Special, Missouri, Montana, Nevada, New Jersey, New Mexico, New York, Ohio, Pennsylvania, Rhode Island,  Vermont, Virginia, Washington, West Virginia, Wisconsin.

Senate – Republican Wins

Mississippi, Mississippi Special, Nebraska, North Dakota, Tennessee, Texas, Utah, Wyoming.

House – Democratic Wins

Alabama – 7
Alaska – none
Arizona – 1-3, 7, 9
Arkansas – none
California – 2, 3, 5-7, 9-20, 24-41, 43-49, 51-53
Colorado – 1, 2, 6, 7
Connecticut – 1-5
Delaware – at large
Florida – 5, 7, 9, 10, 13-15, 20-24, 26, 27
Georgia – 2, 4, 5, 13
Hawaii – 1, 2
Idaho – none
Illinois – 1-11, 14, 17
Indiana – 1, 7
Iowa – 1-3
Kansas – 2, 3
Kentucky – 3
Louisiana – 2
Maine – 1, 2
Maryland – 2-8
Massachusetts – 1-9
Michigan – 5, 8, 9, 11-14
Minnesota – 1-5, 7
Mississippi – 2
Missouri – 1, 5
Montana – none
Nebraska – none
Nevada – 1, 3, 4
New Hampshire – 1, 2
New Jersey – 1-3, 5-12
New Mexico – 1, 3
New York – 3-10, 12-20, 22, 25, 26
North Carolina – 1, 4, 9, 12
North Dakota – none
Ohio – 3, 9, 11, 13
Oklahoma – none
Oregon – 1, 3-5
Pennsylvania – 2-8, 17, 18
Rhode Island – 1, 2
South Carolina – 6
South Dakota – none
Tennessee – 5, 9
Texas – 7, 9, 15, 16, 18, 20, 28-30, 33-35
Utah – 4
Vermont – at large
Virginia – 3, 4, 7, 8, 10, 11
Washington – 1, 2, 6-10
West Virginia – none
Wisconsin – 2-4
Wyoming – none

House – Republican Wins

Alabama – 1-6
Alaska – at large
Arizona – 4-6, 8
Arkansas – 1-4
California – 1, 4, 8, 21-23, 42, 50
Colorado – 3-5
Connecticut – none
Delaware – none
Florida – 1-4, 6, 8, 11, 12, 16-19, 25
Georgia – 1, 3, 6-12, 14
Hawaii – none
Idaho – at large
Illinois – 12, 13, 15, 16, 18
Indiana – 2-6, 8, 9
Iowa – 4
Kansas – 1, 4
Kentucky – 1, 2, 4-6
Louisiana – 1, 3-6
Maine – none
Maryland – 1
Massachusetts – none
Michigan – 1-4, 6, 7, 10
Minnesota – 6, 8
Mississippi – 1, 3, 4
Missouri – 2-4, 6-8
Montana – at large
Nebraska – 1-3
Nevada – 2
New Hampshire – none
New Jersey – 4
New Mexico – 2
New York – 1, 2, 11, 21, 23, 24, 27
North Carolina – 2, 3, 5-8, 10, 11, 13
North Dakota – at large
Ohio – 1, 2, 4-8, 10, 12, 14-16
Oklahoma – 1-5
Oregon – 2
Pennsylvania – 1, 9-16
Rhode Island – none
South Carolina – 1-5, 7
South Dakota – at large
Tennessee – 1-4, 6-8
Texas – 1-6, 8, 10-14, 17, 19, 21-27, 31, 32, 36
Utah – 1-3
Vermont – none
Virginia – 1, 2, 5, 6, 9
Washington – 3-5
West Virginia – 1-3
Wisconsin – 1, 5-8
Wyoming – at large